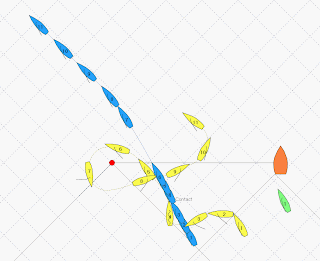
Two people responded and one of them send me a diagram. I think the rules analysis was pretty much covered in the comments these two made, but I am disappointed in the lack of drawings I received. Surely you make diagrams in the protest room? And sailors too, you need to be able to accurately draw what the situation was?
Here's the one Brass send me, made by TSS:

He started by drawing out the information given in the case and quickly discovered that he needed some additional information.
- How far from A was B when B became overlapped to leeward?
- At what point did B cease to change course towards the wind?
- Between when B became overlapped to leeward and when the contact occurred what changes to course or speed did A make?
Because he made the effort to translate the facts into a diagram, these questions arose. I'm not saying that these would not have been asked without a diagram, but it makes it so much easier to find them. Facts are something that has happened, so you must be able to draw them in a picture. And the picture is not complete without all the facts.
If you train yourself in drawing a proper diagram, you will discover that finding the right questions becomes much less of a burden.
So, in order to give you another opportunity, I've made a list of facts found and ask you again to make a diagram. I'm deliberately leaving out a few, so include your questions with the drawing. I'm not going to answer them, you will have to make do with what is posted.
If you're not happy with that - go 'either or' and make two diagrams.
You can use any method you want, TSS, Word pictures or penciled and scanned. Send them to the blogs mail and I'll announce "the winner" sometime next week.
Good luck!
In a valid protest the following facts were found:
- Rainbow 200 on a broad reach on starboard tack, and Kwadraat 77 also on that reach on starboard tack sail, along a (grassland soft) shore.
- The shore makes a slight curve
- Virtually at the same moment both boats gybe on to a port tack.
- At the time of the gybe Kwadraat 77 is 2 meters clear ahead of Rainbow 200.
- After her gybe Kwadraat 77 leaves a gab between her stern and the shore.
- Rainbow 200 sails into that gab and calls for room to pass.
- Kwadraat 77 responds by luffing and there's contact between the boats which results in damage.
- Both boats hit the shore and get stuck.

I think some people are a little intimidated at trying to draw diagrams, either with a pencil or even worse, electronically. Not everyone has a copy of TSS.
ReplyDeletePeople might not have the MS Word diagrams template (so could you please remind us where to find it?)
I think most people would probably find it easier to do layouts with 'the toys', (plastic models)
I've also thought that it might be easy for people to do the layouts with models on a gridded paper, then take a photo with a digital camera to form the diagram.
I think that a systems analysis technique of using more than one diagram might help with complex situations:
1. a 'context diagram' showing the relevant racing area, marks, shorelines and the boats just before the incident
2. a 'zoomed-in' detailed diagram showing the boats during the incident.
Brass
Angelo Buscemi's word file can be found here:
ReplyDeletehttp://rrsstudy.blogspot.com/2007/11/forms-2.html
If you do a layout with boats on the table, you can also just take a pencil and draw the outline of the boat on a piece of paper under them.